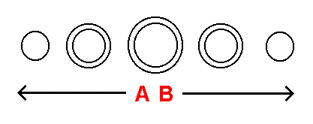
It is impossible for one to directly visualize, as you may have concluded already, a structure of the dimension above one's own. What a stack-diagram allows us to do, however, is to divide higher-dimensional structures into slices that we can visualize - each slice being the equivalent of a structure of our own dimension. The result is by no means a perfect copy of the higher-dimensional structure - but simply a version of the structure that we can comprehend. We will demonstrate this notion by representing in stack-diagram form a model of a spherical 2-dimensional universe - a universe that happens to exist entirely on the surface of a sphere. This universe, being a 2-dimensional universe, would be a universe within which, on perhaps a 2-dimensional planet orbiting some 2-dimensional star, we would find the presence of Flatlanders. A Flatlander, if you don't already know, is an intelligent, thinking 2-dimensional creature who lives in a world limited entirely to a mere length and width (the 2 dimensions of the surface of the sphere). Of what importance, you may ask, would a 'Flatlander' be to us? The fact that we can 'look down' upon a Flatlander, and consider what he is thinking about the world around him, makes what we call a 'Flatlander' invaluable. It is our knowledge of how a Flatlander experiences his own world, you see, that we can make sense of the world that we experience. A Flatlander, it would happen, cannot directly grasp the concept of a sphere (the structure representing the shape of his universe) for the very reason that a sphere is 3-dimensional and the Flatlander's mind is 2-dimensional.
What the Flatlander can in fact grasp, however, is a sphere as it is presented in stack-diagram form. Having been introduced to the concept of a stack-diagram as recently as the end of the previous section, it would not appear hard to grasp how the 'stack-diagram' of a sphere (as presented below on the left) would relate to the sphere as it actually exists. We first divide the sphere into slices. Because the sphere is a 3-dimensional object, the resulting slices therefore extend into 3-dimensional directions. It is quite clear, then, and it is agreed, that the Flatlander cannot comprehend these 3-dimensional directions. What the Flatlander can grasp, however, are the individual 2-dimensional slices themselves, and the fact that even though they extend into 3-dimensional directions, they are nonetheless arranged in a linear fashion. The Flatlander, in turn, arranges the slices in a manner that he understands to be linear, and acknowledges that the linear nature of the slices he has arranged, represents a linear extension into the next dimension. The process just described, in demonstrating the essence of what a stack-diagram is, shows us that even though the Flatlander cannot directly visualize a sphere, it is by means of the stack-diagram that the Flatlander can successfully conceive of the concept of a sphere, regardless of the fact that a sphere is 3-dimensional and the Flatlander's mind is 2-dimensional. Even the most involved processes of the sphere can be expressed to the Flatlander by means of the medium of the stack-diagram - which you will see as we attempt to stretch the visualization capabilities of the Flatlander to the very limit.
 | |
The first challenge involves expressing to the Flatlander the concept of a closed 2-dimensional surface (a 2-dimensional surface that curves back on itself, as a sphere does). Displayed to the left is the model of the spherical 2-dimensional universe we are working with, in stack-diagram form. The Flatlander's best conception of a closed 2-dimensional surface is, as you can see, as an array of closed 1-dimensional surfaces. To better understand this, imagine moving the slices on both sides of the central slice to their 3-dimensional positions behind and in front of the central slice, to form the sphere that the stack-diagram represents. Once the slices are in their appropriate positions, imagine that the slices are 'pressed together', leaving no empty space in between them. Upon doing so, take note of the overlapping circular regions where neighboring slices 'touch'. It is these 'regions of contact' that 'connect' one slice to another, allowing what we will call "communication" to occur across the slices. Given that the slices are 'connected', and given that this allows "communication" to occur across the slices, we find as a very observable result, that all of the connected 1-dimensional surfaces of the slices "combine" to form what we know to be the single 2-dimensional surface of the sphere. Take note, though, that when the slices of the sphere are in stack-diagram form, it is not possible to directly observe the 'regions of contact' among the slices, for the very reason that the slices are individually, separately lined up. Nonetheless, the concept of "communication" across the slices can be applied just as effectively. It is this concept of "communication" across the slices of the stack-diagram that allows the Flatlander to imagine the multiple slices of the sphere to "combine" to form the single 2-dimensional surface of the sphere.
 |
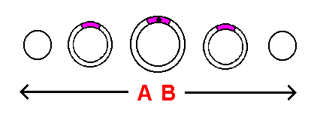 |
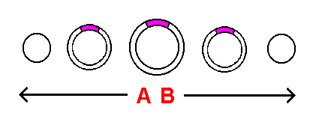
The second challenge involves representing in stack-diagram form a 2-dimensional object on the surface of our model. We will assume that floating about in the upper region of our 2-dimensional spherical universe is a 2-dimensional flying saucer. Our job is to add the flying saucer onto the stack-diagram of the 2-dimensional universe with as little loss of content as possible. Because the 2-dimensional surface we are working with is represented in the form of an array of 1-dimensional surfaces, all 2-dimensional objects on that surface, when represented in stack-diagram form, get "chopped up" into 1-dimensional cross-sections. In order to represent the flying saucer in the stack-diagram, we must divide it into 1-dimensional cross-sections, and spread these cross-sections across the appropriate slices - as is done in the top illustration to the right. The manner in which the cross-sections increase and then decrease in size is a direct result of the flying saucer being circular in shape. If we were to plot a point designating the precise location of the saucer on the sphere shown, it would be at a point located at the exact center of the saucer (in the center of its central cross-section). Such a point is plotted in the next stack-diagram to the right. It is by means of this point that we will refer to the saucer's location in the future. The purpose behind displaying the saucer in the form of 1-dimensional cross-sections (and not just as a point) is to emphasize the fact that the saucer, being a 2-dimensional object, possesses a distinct 'width' that spreads it across a 2-dimensional area of the surface of the sphere - an area that extends across multiple slices of the sphere, that a point by itself cannot portray.
The third challenge involves expressing to the Flatlander how a sphere closes 2 dimensions. Put simply, this is referring to how an object on the surface of a sphere can travel in a straight line, and end up where it started. To better understand this concept, consider the notion that for any given area on the surface of a sphere there is at most 2 lines that can cross and lie at right angles to each other. These crossed lines represent the 2 dimensions of freedom the flying saucer has with which to move on the surface of the 2-dimensional universe. If we extended both ends of each line outward, they would follow a curved path until meeting on the other side of the sphere at the point exactly opposite to the point at which they originally met. These 2 closed loops represent the paths around the 2-dimensional universe that the flying saucer could take given its 2 dimensions of freedom.
The illustrations among the next several paragraphs portray the flying saucer travelling along these paths around the 2-dimensional spherical universe we are working with. The upper sequence portrays a path around this sphere that is parallel to the alignment of the slices. The lower sequence portrays a path around the sphere that is perpendicular to the alignment of the slices. The path parallel to the slices represents a form of closure that a Flatlander is familiar with: the curvature of a circle. The path perpendicular to the slices represents a form of closure that a Flatlander is not familiar with: the curvature of a sphere. Clearly, a Flatlander can grasp the closure of a circle. The closure of a sphere, however, will be difficult to portray given the fact that we are limited to 2 dimensions. The sequences we have been speaking of, as you will see when you reach them, are arranged in a sequential, linear fashion. This format is reflected by the distinct 'frames' the sequences are divided into - each frame representing a separate instant in time in the execution of the sequence. Each individual frame itself, as you will see, consists of the array of slices that we know to make up the sphere.
The presence of the saucer throughout the sequence is made known across the slices of the frames by means of what can be observed to be a point. In the parallel sequence, only one direction is involved in the execution of the sequence (an order of passage that is designated by the numbers next to the frames). In the perpendicular sequence, however, the point can be found to leave a slice within a given frame, and later come back to that frame a second time, returning on a separate slice. As a means of portraying the distinct 2-dimensional 'width' that the saucer possesses on the surface of the sphere (the width described earlier that involves multiple slices and that a point by itself cannot portray), the 1-dimensional cross-sections of the saucer are displayed on the slices of both sequences, appearing on and around the slice of the point designating the saucer's location on the sphere.
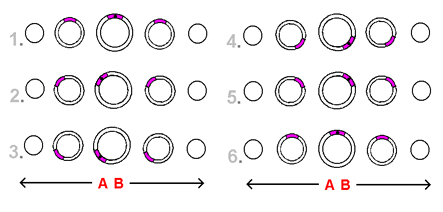 | |
In both sequences, the point representing the saucer's location follows a circular path around the 2-dimensional spherical universe. In the parallel sequence, displayed to left, the point completes the entire process without ever leaving the central slice of the sphere. The perpendicular sequence, however, that lies below, is more complex: though the point makes a trip to the bottom of the central slice and back as in the parallel sequence, the 2 half-circular trips performed involve a slice-to-slice transfer across the slices that surround the central slice (rather than a trip confined entirely to the central slice itself). It is extension of the point into the slices that surround the central slice that represents curvature into the third dimension. This curvature, it would happen, is a direct result of the distinct increase and decrease in size that the inner hollow slices of the sphere undergo, in the process of extending from one small, solid outer slice to the other. Imagine, if you will, for the sake of study, the slices of a 'pressed together' sphere to "combine" to form the single 2-dimensional surface of the sphere. It is the gradual waver in the sizes of the inner hollow slices just described that is responsible for the formation of the spherical curvature that we are familiar with.
In order to make the 2 half-circular trips involved in the perpendicular sequence easier to comprehend (given that we are limited to 2 dimensions), certain 'mental aids' have been added to the sequence. First of all, the sequence is constructed so that the point's path across the stack-diagrams used in the sequence forms a distinct 'circular pattern'. This is an attempt to emphasize the concept of the curvature into the third dimension that the point engages in when following its circular path around the sphere - a curvature that, given that we are limited to 2 dimensions, can be difficult to express. Furthermore, all slices that the point crosses during the length of the sequence are highlighted. Finally, arrows have been added to the sequence that divide the point's circular trip around the sphere into the 2 distinct 'half-circular trips' described earlier. The arrows are to be used as a guide by which one envisions the slice-to-slice traversal of the point as it shifts across the layers of the sequence.
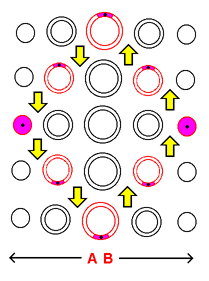 | |
The point's first half-circular trip of the perpendicular sequence (displayed to the left) is from the top to the bottom of the central slice. Imagine that the point at the top of the central slice is being 'pushed' downward in the direction of the arrows (toward the bottom of the central slice). The point "slides" onto the top of the next slice A-ward in response to being 'pushed' into the curvature of the half-circular path it is following. This process of 'pushing' and "sliding" is a 2-dimensional way to portray 3-dimensional curvature. The point is 'pushed' downward once again and "slides" onto the "pole" of the sphere that lies A-ward. Next the point is 'pushed' directly downward across the flat surface of the small solid circular slice, and upon reaching the bottom "slides" onto the bottom of the next slice B-ward. Finally, the point is 'pushed' in the direction of the arrows and "slides" B-ward, in effect returning to the central slice and completing the first 'half-circular trip' along the circular path around the sphere. For the second half-circular trip we are to picture the point to be pushed back upward (in the direction of the arrows) toward the area at which it started, making use of the same 'push and slide' process applied above. If you experience difficulty visualizing the perpendicular sequence, try visualizing it after imagining the slices of the sphere to move over to the central slice and assume their actual 3-dimensional positions behind and in front of it. The stack-diagrams in the 2 sequences just presented represent a Flatlander's basic conception of how a sphere closes 2 dimensions. In the next section we apply what we've learned in this section to the hypersphere.
| to previous section |
to table of contents |
to next section |
||
| Comments, questions, feedback: jsfsite@yahoo.com |